EVALUATING COMFORT COOLING SYSTEM PERFORMANCE.
By Jim Johnson
Copyright © 2014: Technical Training Associates
This is the first
in a series of articles on the subject of HVACR system
performance, and I think it’s appropriate that we begin
by taking a nuts-and-bolts look at some of the simple
tests technicians can accomplish with standard test
equipment when they are checking a comfort cooling
system for proper operation and optimum performance. As
we all know, the “beer can cold” suction line test went
by the wayside long ago, and refrigeration and air flow
system performance analysis requires a more
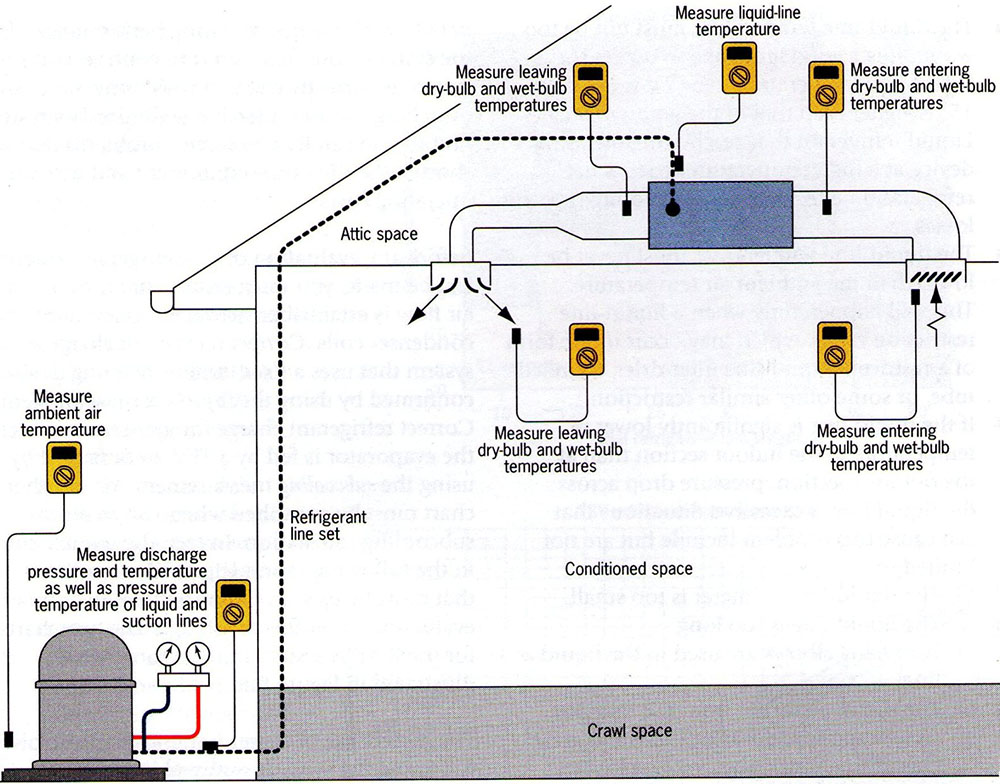
sophisticated approach. The illustration in Figure One
shows the data collection points I’ll be discussing.
 Of
course, one of the most common method employed to
evaluate a system is a standard set of compound gauges
attached the high and low pressure access valves (shown
to the left of our illustration at the outdoor segment
of a typical split system). Unfortunately, this is often
the only step taken to find out if a comfort cooling
system is operating as efficiently as possible, however
there’s much more beyond this basic process that should
be accomplished in the way of performance checks. Let’s
start with one that is very simple and easy to do, yet
tells you a lot about the system. Of
course, one of the most common method employed to
evaluate a system is a standard set of compound gauges
attached the high and low pressure access valves (shown
to the left of our illustration at the outdoor segment
of a typical split system). Unfortunately, this is often
the only step taken to find out if a comfort cooling
system is operating as efficiently as possible, however
there’s much more beyond this basic process that should
be accomplished in the way of performance checks. Let’s
start with one that is very simple and easy to do, yet
tells you a lot about the system.
You’ll
note that in addition to the pressure measurements that
can be taken at the outdoor unit, we are also explaining
that you should test the temperature of the discharge
line. This is a temperature test that should be
accomplished about 6 inches from the compressor, and the
maximum reading you should get is 225 Degrees F. The
bottom line on this test is simple: If you’re getting a
225-degree reading at this point on the discharge line,
then the temperature inside the compressor itself is
going to be approximately 300-Degrees. And, a
temperature higher than that in a compressor crankcase
will mean that some of the oil is vaporizing, which
affects the lubrication process. Of course, the ultimate
result of this situation is premature compressor
failure.
How
does a compressor discharge temperature get too high?
Again, unfortunately, a system overcharge is often the
culprit….a system overcharge that is the result of poor
service procedures like “adding a little gas” in an
effort to increase the performance of the equipment. The
percentage of overcharged residential comfort cooling
systems is literally staggering, and they are not only
failing prematurely, requiring sealed system service
that increases the incidences of refrigerant discharge
into the atmosphere, but they are operating
inefficiently due to increased current draw….a far cry
from proper system performance.
Story
continues below ↓
When it
comes to accomplishing this temperature test, a quality,
professional-grade digital meter that employs a pipe
clamp thermocouple accessory, such as we’re showing in
Figure Two, is one way to obtain the accurate
information you need.
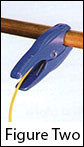
This device will also give you another temperature
reading that provides you with insight into the
operation of the equipment…the liquid line temperature.
In our data collection point illustration, you can see a
point near the indoor unit where you should take this
temperature reading. A good rule of thumb to keep in
mind about this test is that the temperature of the
liquid line should not be more than 15 degrees higher
than the ambient temperature. If it exceeds this
differential, then the temperature of the refrigerant
entering the metering device is too high, which will
lower the overall efficiency of the equipment by causing
a drop in the net refrigeration effect….in essence a
reduction in the transfer of heat from the conditioned
space to the outdoors.
Another
liquid line test you can accomplish is to test the
temperature differential at two points: First at the
liquid line near the outdoor unit, then near the indoor
coil. If the temperature drop is too great, it indicates
either a kink in the line, a restriction for some other
reason, or a design or installation problem relative to
the liquid line, that will prevent the system from
performing properly.
In addition to refrigerant piping temperature tests, a
Type-K thermocouple device that connects to a digital
meter (shown in Figure Three) will allow you to accomplish dry bulb temperature tests, and the same kind
of device equipped with a wet sock (Figure Four) will
provide wet bulb temperature information. Using these
accessory devices as we’re showing in our data
collection points illustration on the return and supply
ducts will tell you if there is a problem in the duct
system that is affecting performance. A significant rise
in the dry bulb
accomplish dry bulb temperature tests, and the same kind
of device equipped with a wet sock (Figure Four) will
provide wet bulb temperature information. Using these
accessory devices as we’re showing in our data
collection points illustration on the return and supply
ducts will tell you if there is a problem in the duct
system that is affecting performance. A significant rise
in the dry bulb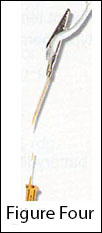 temperature between the return air grille and the duct
near the indoor unit indicates air leakage into the
return, or insufficient insulation. Likewise, a
significant dry bulb temperature rise between a location
in the supply duct near the indoor coil and a supply
register will indicate duct leakage or insulation
problems in the supply side of the air handling system.
temperature between the return air grille and the duct
near the indoor unit indicates air leakage into the
return, or insufficient insulation. Likewise, a
significant dry bulb temperature rise between a location
in the supply duct near the indoor coil and a supply
register will indicate duct leakage or insulation
problems in the supply side of the air handling system.
And,
taking wet bulb readings at these locations, and then
applying the dry bulb and wet bulb information to a
psychometric process will not only allow a technician to
calculate humidity that will prove duct leakage if there
is a increase in humidity between the two test points,
it will also serve as the basis for calculating
superheat, which is a subject I’ll discuss in the next
segment in this series.
Jim Johnson is the Director of Training for Technical
Training Associates, a Tucson-based firm that develops
HVACR technician training DVD’s, soft skills training
for technicians, and provides on-site training. To reach
Jim, call 520-625-6847, visit
www.techtrainassoc.com or email directly to
jim@techtrainassoc.com.
|